
Excel makes you the most powerful person - Part 1

Excel exists since 1985 and it is being constantly developed because people use it daily. No other tool has been used in offices for such a long time. No end in sight.
Why?
Recently, I talked to my client Andrej (let's call him that). He is a student but works in a risk department besides his studies.
There was a Spreadsheet about the customer and the risks, etc. He asked himself what he could get out of the data? He cleaned, crunched and rearranged the data and created insights, predictions, etc. The result?
Because of his Excel sheets, he was invited to present to the VP, SVP, and the Board of Management.
All managers gathered around him. They wanted to be part of the success. Let that sink in. A student with Excel!
Forget PowerPoint's, Meetings, and workshops. These things don't create results. They create the next step in a process chain.
Data rules the worlds and that is what Managers are looking for:
Facts and figures are the undeniable truth. They force action. You force action.
When you master Excel then you are able to provide these insights quickly, reliably, and with great dashboards.
But how to use Excel and what are the best functions?
Let me provide an overview of the possibilities on how you can create max output. This is based on 20+ years of battle-proven experience.
Note: This article is not an Excel tutorial. I have added links to detailed tutorials.
Core functionalities of Excel
I will not waste any time and jump to the point. Excel has four core pillars:
- Formulas or classical Excel
- Power Query
- Power Pivot
- VBA
Let's dive into each of them and how they can help you.
1. Formulas / Classical Excel - Within a table, you can operate with formulas like "IF", "SUM", "VLOOKUP". This creates first insights about the data.
Different formulas can be nested and create a deeper logic. Questions like "IF( the sum of Cells A1 +B3 > F5, then do this or that)." No big deal - basics.
Nowadays, you can use ChatGPT to help you generate the formulas. Plus, you learned or used Pivot Table. A powerful way to summarize and analyse data.
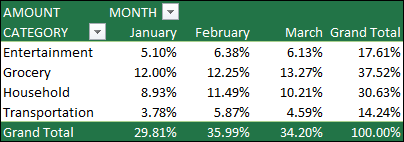
Most people know this world. I call it the basics of Excel. Let's go beyond.
2. Power Query - 95% of people don't know this functionality - only the pros do. Power Query is for connecting, transforming, combining the data.
Power Query is the first step to Data Analytics.
The first magic is that it reads and loads data from different sources:
- Excel, Text, CSV files
- Web pages
- Databases
- PDFs
- SharePoint/OneDrive
- etc.
Yes, it grabs data and tables from PDFs! Try it. Amazing.

In classical Worksheet tables, you can perform changes. These changes are irreversible. (We neglect for a moment the step backward CTRL+Z .)
There are no data workflows like data cleaning (leave out the blank, replace automatically, etc.)
Power Query can do that, and you can change your data workflow at any time in the future. It shows you the applied steps:
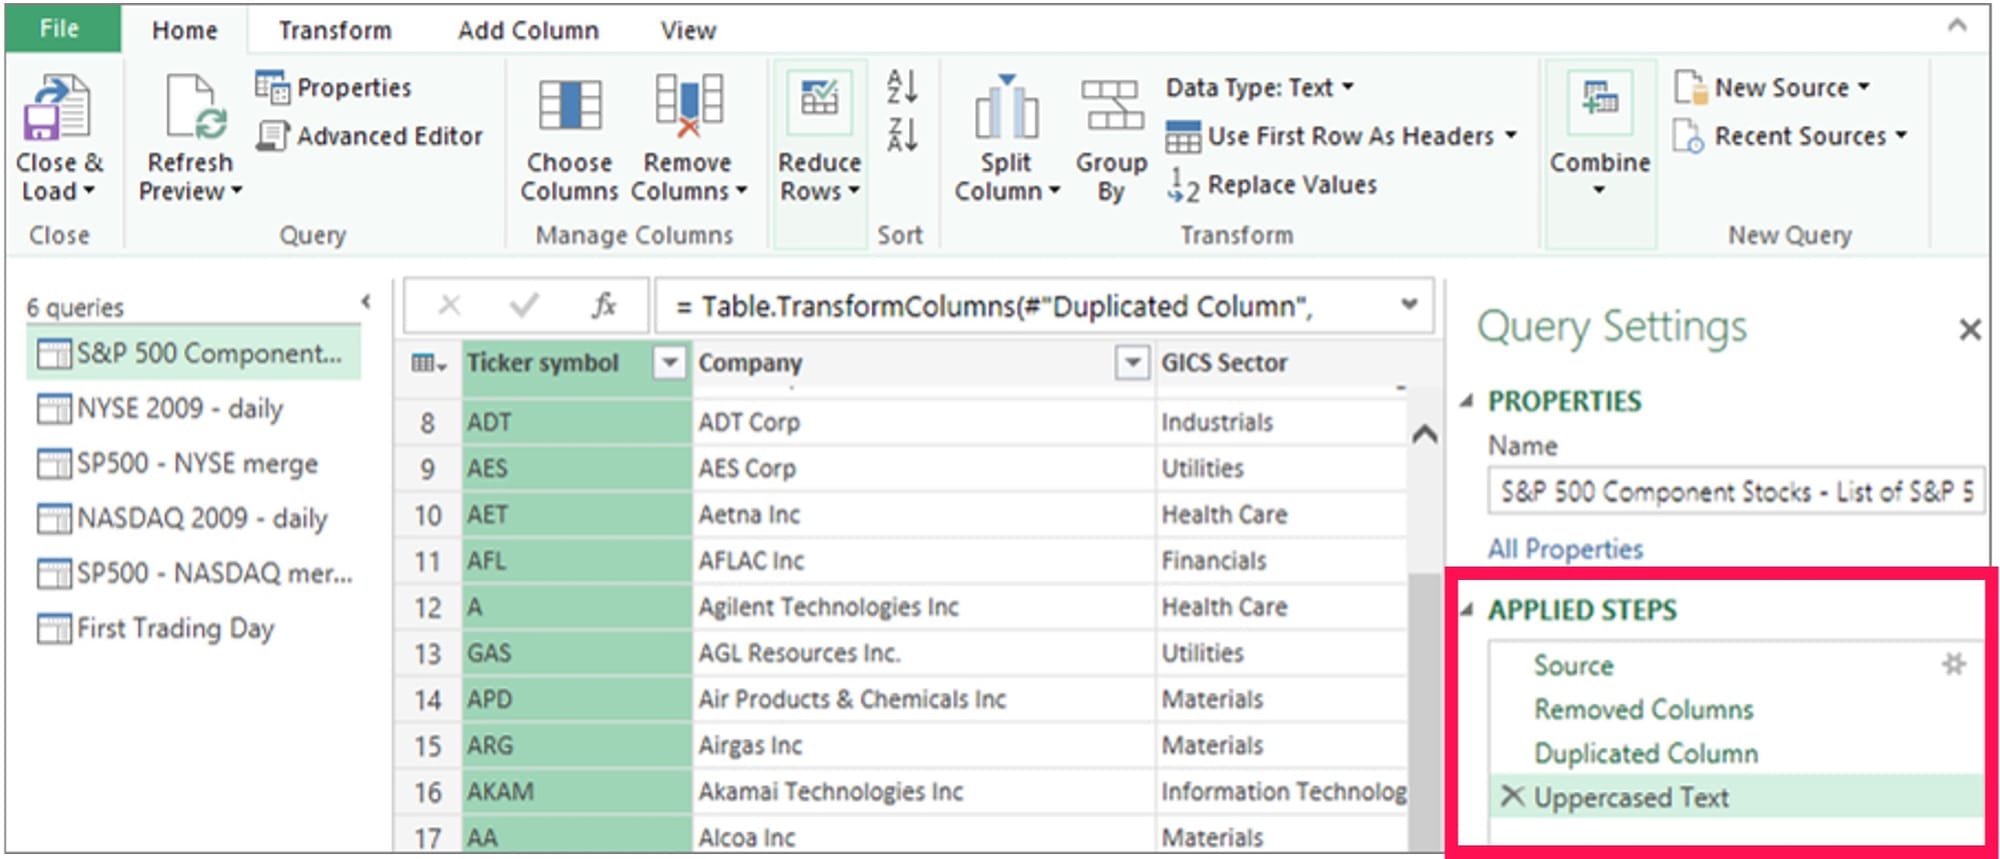
Isn't that amazing? You see the removed, duplicated, or rearranged column steps! You can go back and delete or replace this step. WOW! Not possible in classical Excel.
Imagine how often you rearrange columns or add some. After intensive data preparation in Excel, you lose the overview of what has been done. Not so with Power Query.
One often needed option is: Merging or joining tables. Yes, it sounds like data base operations, but without coding. You click and get what you want. Take a look:
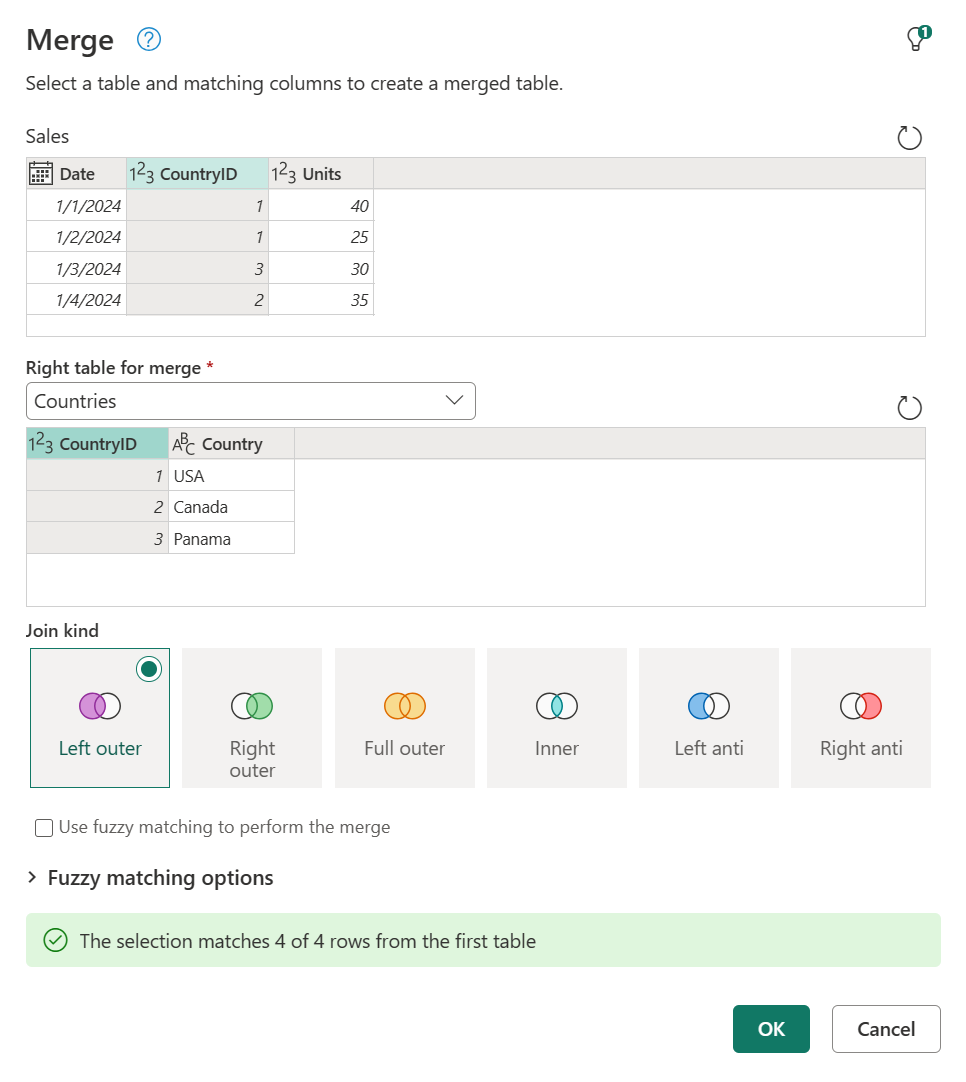
Do you spot the "Fuzzy matching options"? Use it when the columns contain names and they only almost match, like customer names: Daimler AG and Daimler.
Overall, Power Query is great to automate data steps. When you have repetitive tasks, like multiple Excel files in a folder. Load them all, apply the data cleaning, and prepare.
The applied steps are saved. Whenever you get new files, you just hit refresh, and all steps are applied to the new files. Job done in less than 60 seconds.
For the best tutorial, check out Mynda Treacy's webpage and videos [2]
(No affiliate - this woman is the best Excel teacher I have ever seen.)
My Advice: With Power Query you develop the biggest data power.
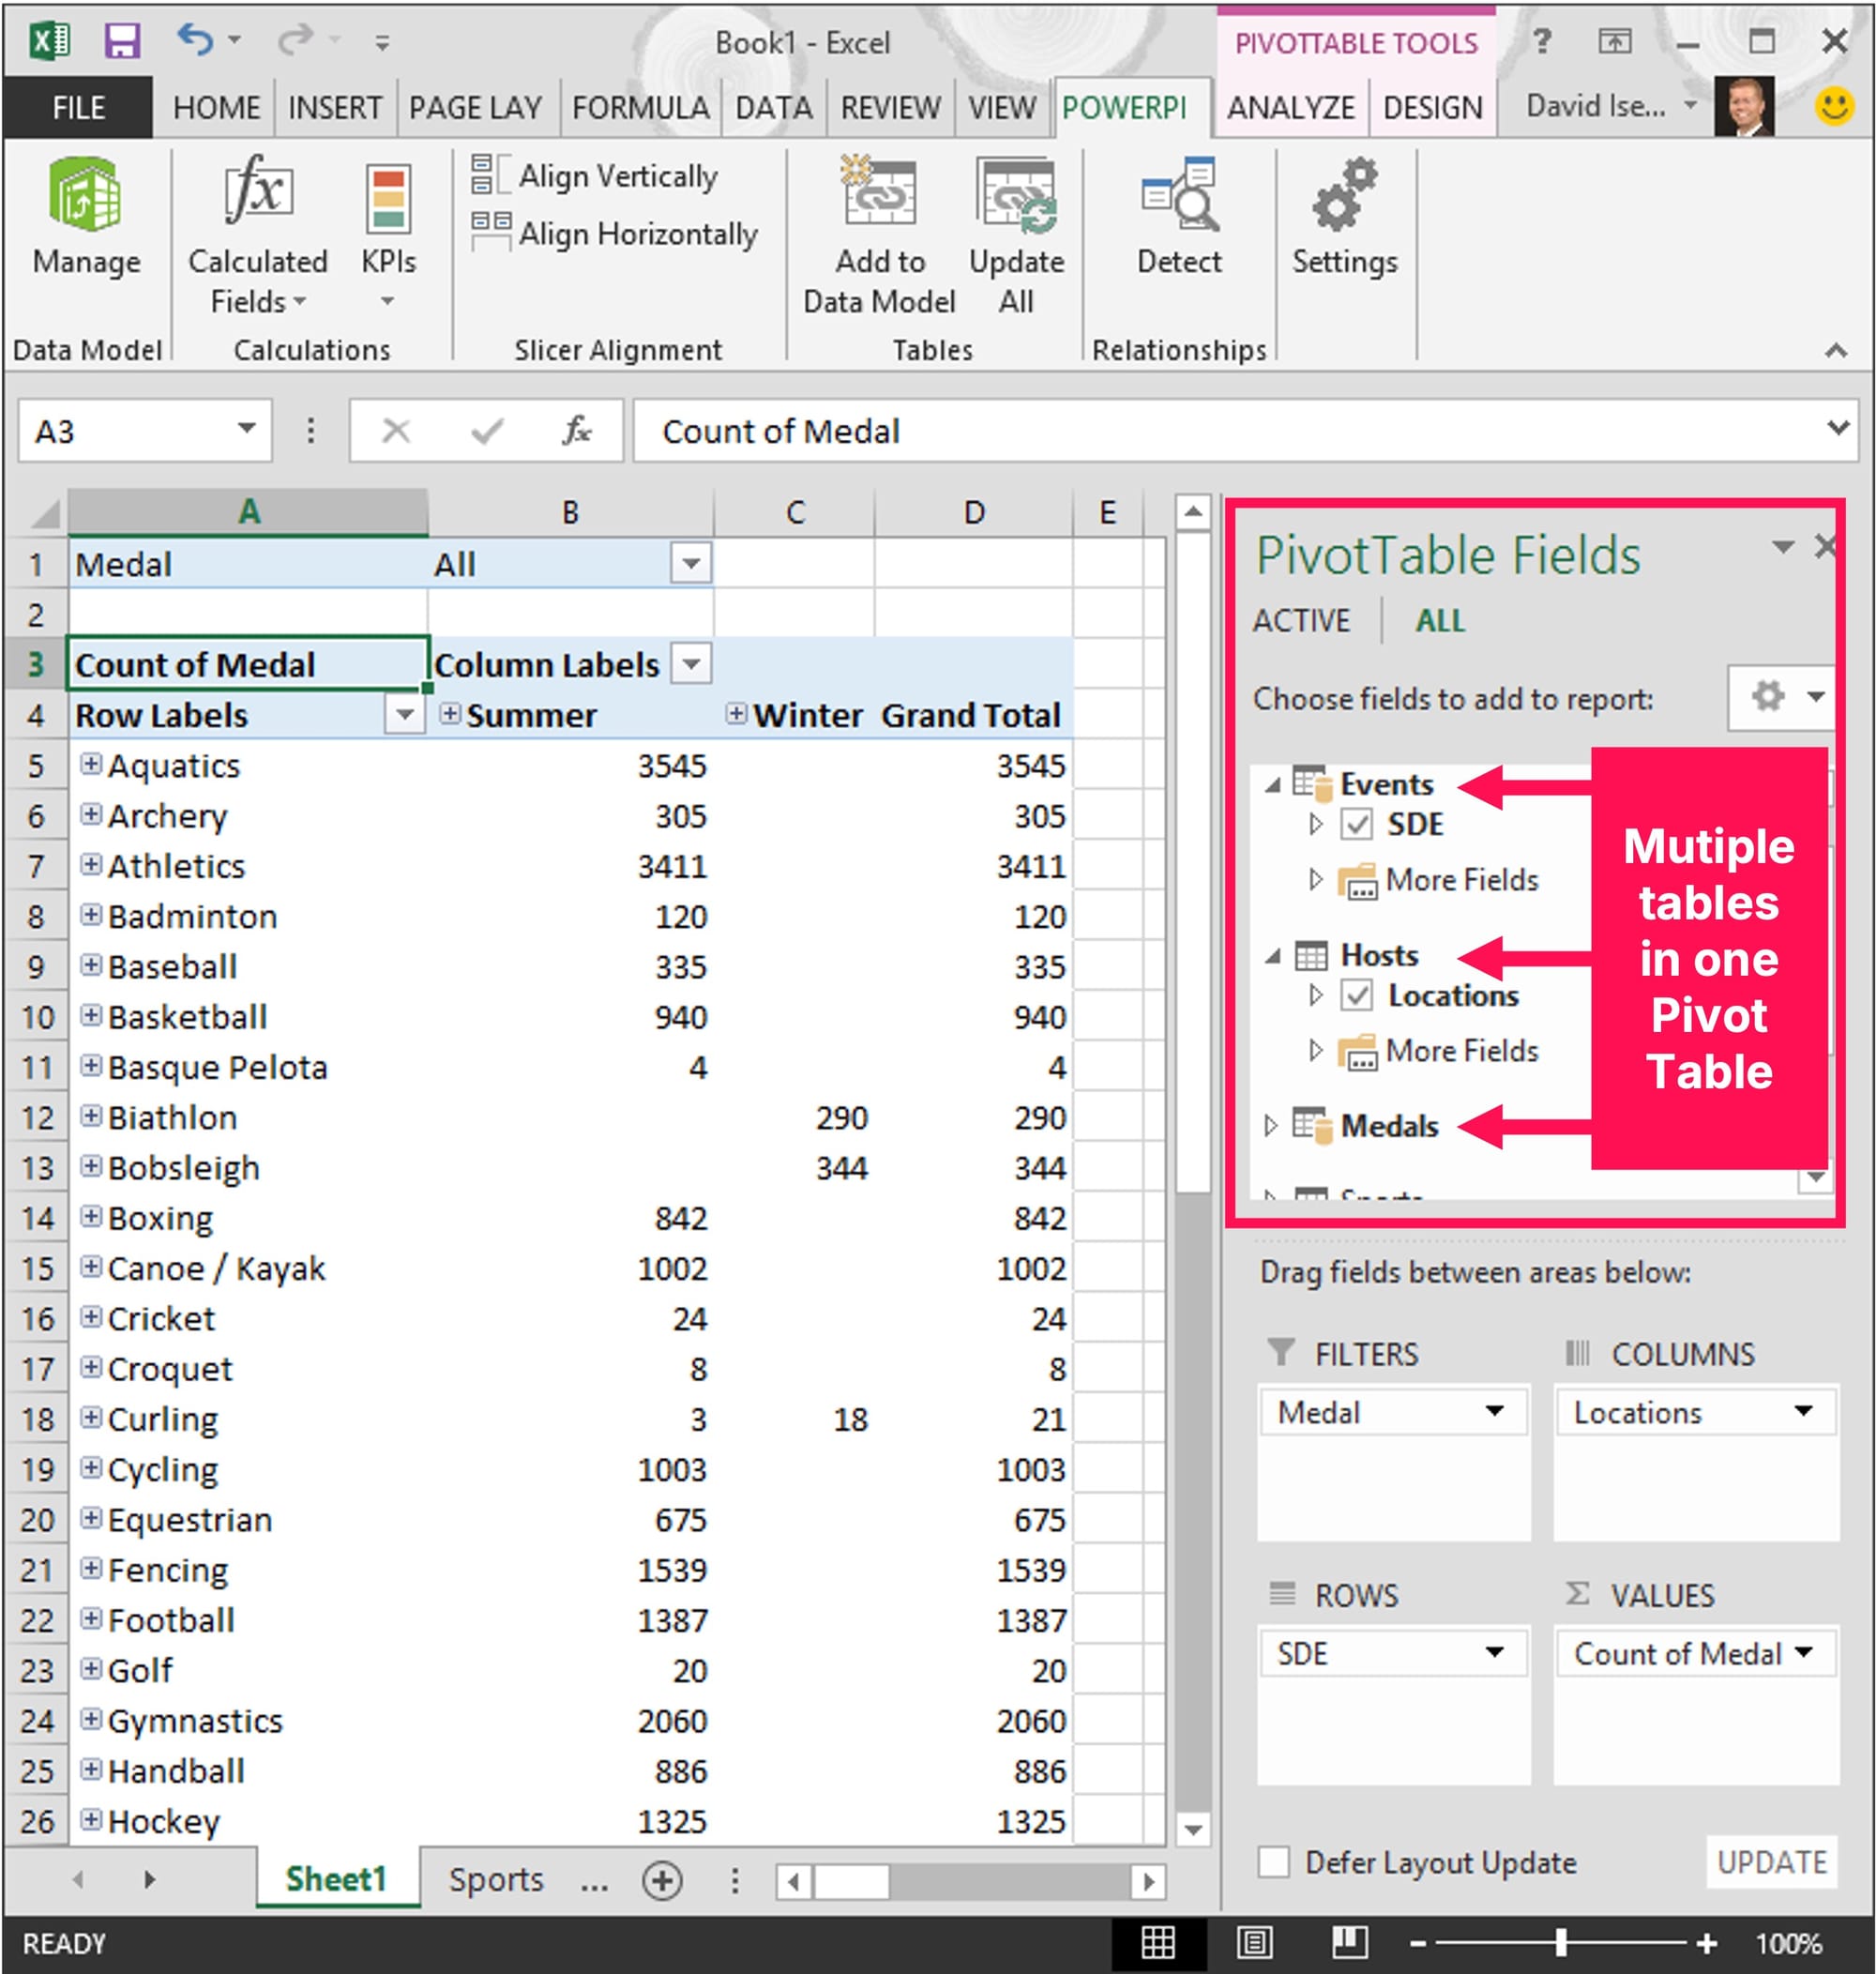
3. PowerPivot - Don't mix it with Pivot tables like seen above. Power Pivot is next level sh*t: What to do when you have different sources and the data is in different tables?
Power Pivot combines different sources in one data model.
Imagine you have the sales data in one table with the product IDs, but the product names and unit prices in another. In addition, the regions are saved in another.
When data sources are big, then combining them into one table isn't feasible. Use Power Pivot and build a data model:
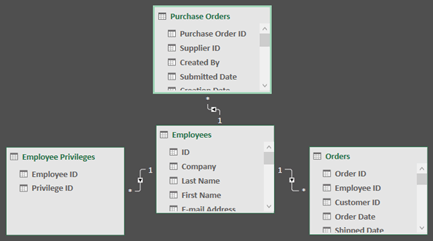
Once the model is built, you can load the data. Then create a Pivot table and aggregate data.
Also, here is a link to Mynda Treacy's tutorial.
My advice: PowerPivot is powerful but only used in highly sophisticated data model cases - like in finance. Know that is exists and what it does.
Note: I have left out the DAX formulas. These are formulas to operate in the data model. This goes beyond and only needed by the pro data users.
4. VBA - Visual Basic is the programming possibility of Excel.
Let's keep it short: I don't like it because the programming language is not logical. It has its own rules and isn't comparable to any other language. You can't transfer the knowledge.
Nowadays, for me, any time invested in VBA is a waste of time.
Of course, VBA opens the door to a more powerful world in Excel. But frankly speaking, most often it solves problems a real IT system should cover.
My advice: Whenever you tend to use VBA ask yourself: Shouldn't this be done by an IT-system on its own? If the answer is yes, something is odd in your company. Avoid using VBA.
Summary
I showed you the first part about Excel: core functionalities on how to use Excel and what to learn. This enables you to learn the right things: Classical Excel, Power Query, and Power Pivot. Focus on Power Query. Don't wast your time with the wrong things. You will be ahead of 99% of people.
But there are some topics missing to create maximum impact. The next newsletter will cover Core Pitfalls in Excel, Dashboards and Diagrams, Ask the right Data Questions - Know your Business. Don't miss the next edition and subscribe.
Sources:
[1] https://support.microsoft.com/en-us/office/create-a-pivottable-to-analyze-worksheet-data-a9a84538-bfe9-40a9-a8e9-f99134456576
[2] https://support.microsoft.com/en-us/office/about-power-query-in-excel-7104fbee-9e62-4cb9-a02e-5bfb1a6c536a
[3] https://learn.microsoft.com/en-us/power-query/merge-queries-overview
[4] https://www.myonlinetraininghub.com/get-started-with-power-query
[5] https://support.microsoft.com/en-us/office/power-pivot-overview-and-learning-f9001958-7901-4caa-ad80-028a6d2432ed
[6] https://support.microsoft.com/en-us/office/tutorial-extend-data-model-relationships-using-excel-power-pivot-and-dax-cf7197d3-1938-490e-93fb-20371e8dd67a
[7] https://www.myonlinetraininghub.com/introduction-to-power-pivot-in-excel